

The Data Science Initiative at UNC Charlotte held the Analytics Frontiers conference in Charlotte, NC on March 30, 2016. The all-day event featured keynote presentations by several of the most prominent voices in data analytics – Tom Davenport, who teaches at Babson College, Boston University, Harvard Business School and the Sloan School at Massachusetts Institute of Technology; David Kiron, executive editor of MIT Sloan Management Review’s Big Ideas initiative, and MIT professors Dr. Sam Ransbothan.
Over 400 attendees participated in the event, which highlighted Charlotte as a national hub for data analytics. Along with the keynote speakers, the conference included:
- Panel discussion on UNCC’s Data Science Initiative
- Panel discussion on Big Data – Lies, Damn Lies, and Statistics
- Breakout sessions on various topics including Smart Cities, Security Analytics, Data Analytics for Social Good, Internet of Things, Mobile Analytics, and other topics (see complete Agenda here)
The challenge in attending an event of this magnitude is not being able to participate in every session! For this conference recap, we will focus on three areas: Tom Davenport’s lunch keynote - Four Eras of Analytics, the Smart Cities panel, and the Mobile Analytics panel.
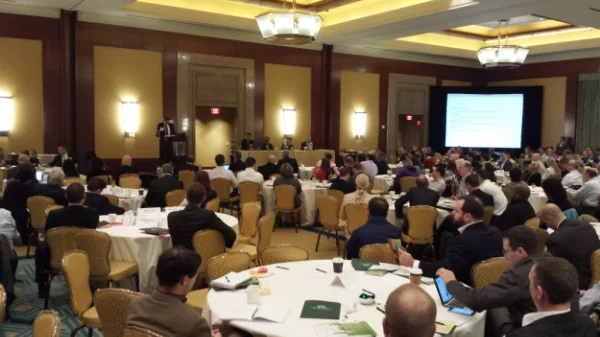
400+ in attendance at Analytics Frontiers 2016
Four Eras of Analytics
Dr. Davenport engaged the crowd by describing the four eras of data analytics, and how the move to cognitive is affecting our jobs, society, and the world.
Era One was described as traditional analytics - Business Intelligence.
Era Two was the Big Data era, where we started seeing firms offering online ‘data products’.
Era Three is the era for a fast business impact for the data economy. Analytics are becoming core to the business, and it is all about scale and scope.
Era Four is where we are moving - analytics for automated decisions. We are seeing a transition from Analytics to Cognitive, automating ‘knowledge tasks’. Dr. Davenport remarked that human often “suck at decision making”, and automated decisions remove biases from the equation. The remainder of his talk was on the impacts and concerns for the transition to cognitive.
Why the move to Cognitive?
- Handle tedious work
- Labor can be expensive
- Too much data for humans to absorb
- Humans are not always good decision makers
Dr. Davenport went on to explain that automation could sometimes be viewed as a pain. At a minimum, there is often a substantial displacement of human workers. In many cases, humans prefer to be served by other humans, rather than a machine. Industries that heavily automate frequently have a ‘race to the bottom’ on cost and profits. Lastly, automation can be difficult to combine with creativity and frequent innovation. In the 18th and 19th centuries, automation replaced manual work. In the 20th century automation replaced administration and service jobs. In the 21st century, automation will be replacing knowledge work, if not the entire knowledge worker, it will be many of the knowledge tasks.
He identified 10 knowledge work jobs with automatable tasks:
- Teachers/Professors – online content, adaptive learning
- Lawyer – e-discovery, predictive coding
- Accountants – automated audits and tax
- Radiologists – automated cancer detection
- Reporter – automated story writing (a North Carolina example is Automated Insights)
- Marketer – programmatic buying, focus groups, personalized emails, etc.
- Financial Advisor – robo-advisor (example Betterment)
- Financial Asset Manager – index funds, trading
- Programmer – automated code generation
- Quantitative analysts – machine learning
Dr. Davenport explained that technology is the driving force behind knowledge work automation. Analytics and Big Data, machine learning, neural networks, rules engines, cognitive computing (like IBM Watson), and custom integrations and combinations of these in a “cognitive cloud” all are contributors to the change.

So what is a knowledge worker to do? He suggested there are five responses:
- Step in. Master the details of the system, know its strengths and weaknesses, and know when it needs to be modified.
- Step up. Take a big picture view of computer-driven tasks and decide whether to automate new domains.
- Step aside. Focus on areas that automation does not do well today.
- Step narrowly. Focus on niche knowledge domains that are too narrow to be worth automating
- Step forward. Build the automated systems.
Dr. Davenport concluded by expressing a few concerns that need to be addresses. We do not fully understand interconnected decisions well. He cited examples including a flash stock market crash, power outages, and air transportation adjusting to weather events. We need to be able to model dynamic interactions between humans and automated decisions, and have a ways to go.
Smart Cities Panel

Highly recommended reading on Smart Cities
The panel was composed of Rob Phocas from the City of Charlotte, Rob Cox from UNCC, and Bradley Rash from Duke Energy. The panel focused on Envision Charlotte, an effort that uses data and technology to address problems and create solutions for the urban core. The remarks were largely focused on the using data to improve energy management in center-city Charlotte buildings.
Bradley Rash from Duke Energy explained lessons learned on collecting and storing the energy data:
- One must consider privacy (it is the customer’s data) and you need to obtain user permission to utilize the data.
- One must evaluate the data, and think about how you will eventually use the data, prior to access and storage.
- Determine upfront the resources, capital and people, needed for the effort.
- One must be persistent. Energy studies are a long-term commitment, and one has to maintain excitement and energy in the program. The Envision Charlotte energy study consumed 5 years.
The panel explained that over the span of the program, energy usage decreased approximately 17%, resulting in a cumulative savings of about $17M. This is aggregated data. One of the lessons learned in the program was individual building owners did not want their data shared, fearing it could negatively affect their lease rates. New York City has a public disclosure law to share energy and water consumption data, but Charlotte has not done this yet, and can only share aggregated data. Bradley was asked why Duke Energy participated in the program, given this appears to be a revenue reduction for them. Bradley explained that the reduced usage allowed Duke to delay large capital investments for energy production, and the revenue drop was somewhat offset by Federal credits.
One of the difficulties for the project team was explaining to building owners what had never been done before in Charlotte. People struggled with the value proposition in participating. There is a large quantity of energy and water consumption data, but it is difficult for the owner to get time to review it, and it is hard to place an ROI on it. The owners wanted someone to tell them what to do. The study proved the point that just because we can obtain data, or analytics, does not mean we know how to use it, have time to analyze it, or know what to do if the data conflict with other data.
UNCC identified a role for academia to address questions on how to integrate and ascribe value to data, how to develop a replicable model, and focus on applied research. As an example, UNCC has been matching students to building owners as part of their educational experience. The students have time to analyze the data, and the owners receive the recommendations on low hanging fruit. Rob Phocas said that the City of Charlotte applied for the MetroLab Network, a recently launched network of more than 20 city-university partnerships focused on “smart cities”. This Network is part of the White House’s Smart Cities Initiative. Still to be determined is quantifying the value from an economic development perspective.
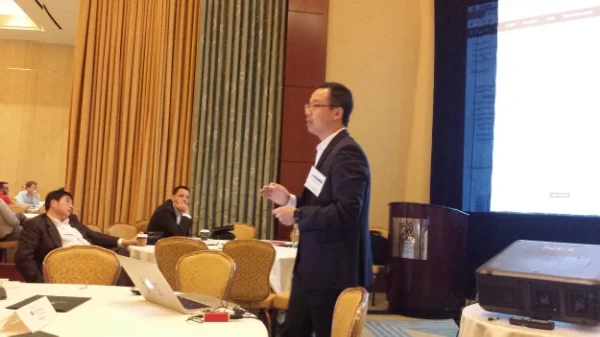
Derek Wang - CEO of Taste Analytics
Mobile Analytics Panel
One of the afternoon panel discussion focused on data analytics in mobile. Dr. Mohamed Shehab from UNCC joined Derek Wang, CEO of Stratifyd (formerly Taste Analytics) for presentations, demos, and discussion. (Note: Stratifyd is a Growth Partner for Charlotte Hearts Gigabit.) Data from mobile devices is being used to improve the user experience, and both speakers provided examples.
Dr. Shehab demonstrated several beacon applications that interfaced with a user’s smartphone.
- A location app that changed the audio being played as a user moved throughout a room. The beacons tracked the user location and changed the audio to match.
- An app that served as a survey tool for student users, to rate their experience when they were in different locations on campus. This app cleverly asked the students to identify beacon locations and name them, or agree with other users’ naming conventions.
- One of the most interesting apps was an on-premise mapping app with turn-by-turn directions. Similar to what Google maps has for outside navigation, the app implemented within a building using beacons to determine user locations. The app was built for a local hospital of a major HealthCare company in Charlotte. It provides turn-by-turn audio instructions, along with a detailed interior building map that changed as the user walked through the hospital. For anyone that has gotten lost in a hospital, you can see the commercial potential!
Demo of the Stratifyd Signals Platform
Next, Derek Wang presented how data from the mobile app stores is used to improve the customer experience. Derek demonstrated the Signals data analytics platform, and the built-in data connectors to the App Store and Google Play. The demo connected to the app stores and scraped the customer review data, which is in unstructured text format. The platform analyzed the data and displayed the main categories of customer feedback, a buzzword graph, temporal trends, Geo analysis, and sentiment score.
The text analytics platform is interactive and visual, and Derek demonstrated how a user could drill down into each area simply by clicking on a term of interest. In this way, the user can get to the ‘why’ behind the data to understand what people are saying. He showed how the platform allows the user to conduct side-by-side comparisons. Derek explained that one of their customers, a large bank, examined the customer feedback and learned a glaring difference in the Android version versus the iOS version. The actionable insight was extremely valuable to the client.
Consumers frequently rate their experience via their smartphone, and outside of the app stores themselves, users are rating products on Yelp, Amazon, Facebook, Twitter, and a host of ecommerce sites. Derek demonstrated how the platform is used to extract value from unstructured data across multiple platforms where mobile users are entering data. If there is a structured field, such as a 1-5 star rating, the Taste Analytics platform allows the user to pivot the data on any of these fields.
What most impressed the audience was the ease of use. The visualization and the intuitive feel of the user interface greatly simplified what is, no doubt, a complicated NLP engine behind the scenes. Derek explained that the platform is built for the front line user – a Customer Service Manager, a Product Manager, an Analyst. One does not have to be a data scientist to use it. Based on my observations, many people in the audience planned to try a free account to check it out (http://stratifyd.com).
We could not attend all of the sessions. For an additional perspective, and a recap of the morning keynote session: Competitive Advantage from Analytics from MIT professors Dr. David Kiron and Dr. Sam Ransbothan, and the Internet of Things panel discussion, read this post by Christina Kyriazi.
Data Analytics and Gigabit Internet infrastructure are two technology areas where Charlotte is taking national leadership. We offer a blend of University expertise in UNCC, Gigabit Internet from Google Fiber and AT&T, and a strong tech startup ecosystem as demonstrated by Stratifyd.
We look forward to another Analytics Frontiers conference in 2017!